


Redistricting history and process

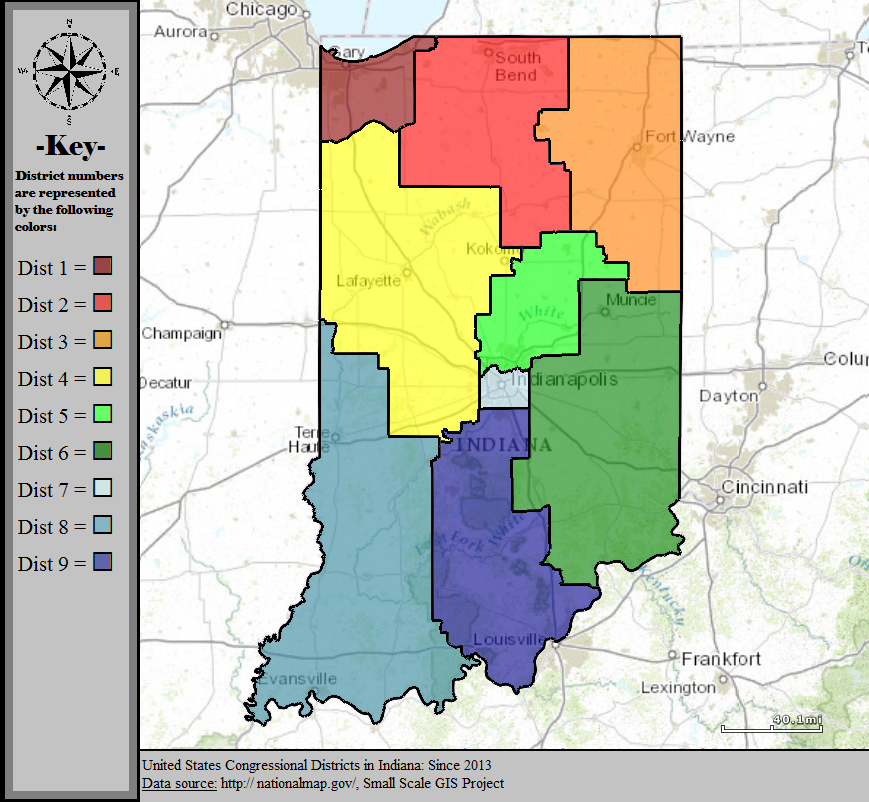
Indiana has had nine congressional districts since the 2000 Census, when it lost its 10th district. The state has had as many as 13 congressional districts, but gradually lost districts over the 20th century.
In Indiana, congressional districts are redrawn by the legislature, with the Governor able to veto. Because Republicans control both, they had complete control of the redistricting process. Indiana’s legislature redrew their congressional map to be marginally favorable to Republicans. Against expectations, Republicans did not substantially weaken the Democratic-leaning 1st district. Instead, their only major change was to shore up the 5th district.
Under the previous decade’s map, Republicans split off Democratic-leaning portions of Indianapolis into the 5th district. This decision was made in order to boost Republican odds in the Indianapolis-based 7th district. Republicans had good reason to believe this could work; the seat had been competitive in 2006, and Mitch Daniels carried Marion County in 2008 amidst Barack Obama’s blue wave. However, because Indianapolis continued to shift left, this decision failed to produce results. In fact, it nearly backfired; the 5th district became a marginal seat by the end of the decade.
Under the new map, Republicans returned the Democratic-leaning portions to the 7th district while shifting staunchly Republican south Indianapolis into the 6th district. As a result, the 5th district is no longer competitive.
Demographic breakdown
| District | White | Hispanic | Black | Asian | Native | Pacific |
| 1 | 63.2% | 14.3% | 18.9% | 1.8% | 2.1% | 0.1% |
| 2 | 79.4% | 9.2% | 7.1% | 1.9% | 2.2% | 0.1% |
| 3 | 83.1% | 5.5% | 6.6% | 2.8% | 1.8% | 0.1% |
| 4 | 83.4% | 5.9% | 4.0% | 4.3% | 1.9% | 0.6% |
| 5 | 83.4% | 3.8% | 6.6% | 3.9% | 1.8% | 0.1% |
| 6 | 84.0% | 4.2% | 4.5% | 5.1% | 1.9% | 0.1% |
| 7 | 50.4% | 12.2% | 33.4% | 2.7% | 2.0% | 0.1% |
| 8 | 89.2% | 2.5% | 4.6% | 1.3% | 1.8% | 0.2% |
| 9 | 88.5% | 3.3% | 3.4% | 2.3% | 2.1% | 0.1% |
| State | 78.3% | 6.8% | 9.9% | 2.9% | 2.0% | 0.2% |
Like most of its neighbors in the Midwest and Rust Belt, Indiana has a higher-than-average population of non-Hispanic whites and a low percentage of racial minorities. The largest minority group in Indiana – Black voters – comprise around 10% of the state’s population, ranking 25th among U.S. states. Black voters in Indiana are predominantly clustered in two districts: the 1st district, home to the predominantly Black city of Gary, and the 7th district, which is based entirely in Indianapolis. With a non-Hispanic white population of only 50.4%, the 7th district is the most diverse seat in the state.
| District | Bachelor’s or higher | Rank (of 435) | Non-college white | Rank (of 435) |
| 1 | 24.0% | 335 | 49.4% | 161 |
| 2 | 23.0% | 357 | 65.2% | 50 |
| 3 | 23.5% | 345 | 66.5% | 43 |
| 4 | 30.1% | 230 | 63.3% | 56 |
| 5 | 37.9% | 116 | 54.9% | 116 |
| 6 | 27.0% | 284 | 66.9% | 40 |
| 7 | 33.1% | 178 | 33.3% | 293 |
| 8 | 21.5% | 386 | 72.6% | 9 |
| 9 | 24.8% | 326 | 70.4% | 21 |
Indiana’s education attainment is broadly below-average. All but three of the state’s congressional districts rank in the top quartile for non-college educated whites, and five of its districts rank in the lowest quartile for college education. The exceptions to this are IN-05, which contains the highly college-educated and affluent Hamilton County, and IN-04 and IN-07, which contain Perdue University and IUPUI, respectively.
Political history
| District | Biden | Trump | Margin | Swing |
| 1 | 53.4% | 45.0% | D+8.4% | R+3.5% |
| 2 | 37.8% | 60.4% | R+22.6% | D+2.5% |
| 3 | 34.0% | 63.9% | R+29.9% | D+4.2% |
| 4 | 34.3% | 63.4% | R+29.1% | D+4.9% |
| 5 | 41.0% | 57.0% | R+16.0% | D+7.4% |
| 6 | 33.0% | 64.9% | R+31.9% | D+5.2% |
| 7 | 70.3% | 27.9% | D+42.4% | D+6.7% |
| 8 | 32.7% | 65.5% | R+32.8% | D+1.2% |
| 9 | 35.4% | 62.8% | R+27.4% | D+0.9% |
| State | 41.0% | 57.1% | R+16.1% | D+2.9% |
Indiana has long been a Republican stronghold at the federal level. The state has only voted for Democrats in fifth presidential elections since the start of the 20th century (1912, 1932, 1936, 1964, and 2008). Downballot, however, the state has proven more idiosyncratic. As recently as 2010, a majority of the state’s congressional delegation consisted of Democrats, and two Democratic Senators (Evan Bayh and Joe Donnelly) have been elected since the start of the 21st century.
However, since Barack Obama’s shocking victory in the state in 2008, Indiana has firmly aligned itself both up and down the ballot into a Republican stronghold. Republicans currently hold all statewide offices, as well as supermajorities in both houses of the state legislature.
In the 2020 election, Indiana shifted roughly as Democratic as the nation did. This trend was sharpest in the 5th district, home to affluent Hamilton County, and the 7th district, home to Indianapolis. The only district to shift right is a concerning one for Democrats – the 1st district. Massive population decline combined with working-class trends make this seat a ticking time bomb, virtually guaranteed to lean Republican by the end of the decade.
2022 election results
| District | Incumbent | Democratic | Republican | Result |
| 1 | Frank Mrvan (D) | 52.8% | 47.2% | D+5.6% |
| 2 | Rudy Yakym (R) | 32.4% | 64.6% | R+32.2% |
| 3 | Jim Banks (R) | 30.1% | 65.3% | R+35.2% |
| 4 | Jim Baird (R) | 31.8% | 68.2% | R+36.4% |
| 5 | Victoria Spartz (R) | 38.9% | 61.1% | R+22.2% |
| 6 | Greg Pence (R) | 32.5% | 67.5% | R+35% |
| 7 | André Carson (D) | 67% | 30.6% | D+36.4% |
| 8 | Larry Bucshon (R) | 31.5% | 65.7% | R+34.2% |
| 9 | Erin Houchin (R) | 33.6% | 63.6% | R+30 |
Republicans won seven out of Indiana’s nine congressional districts. This was a generally disappointing result for the party – Indiana’s 1st congressional district was seen as a prime pickup opportunity. However, incumbent Democrat Frank Mrvan was able to win by nearly six percentage points.
None of the state’s remaining congressional districts were competitive, and Republicans outperformed Trump’s margins in all of them, often by double-digit margins.
Current Representatives
- IN-01: Frank Mrvan (D-Highland)
- IN-02: Rudy Yakym (R-Granger)
- IN-03: Jim Banks (R-Columbia City)
- IN-04: Jim Baird (R-Greencastle)
- IN-05: Victoria Spartz (R-Noblesville)
- IN-06: Greg Pence (R-Columbus)
- IN-07: André Carson (D-Indianapolis)
- IN-08: Larry Bucshon (R-Evansville)
- IN-09: Erin Houchin (R-Salem)