


Redistricting history and process

Idaho was admitted as a state in 1890. Since the 1910 census, the state has been apportioned two Representatives in the House, although it did not draw a second district until 1918.
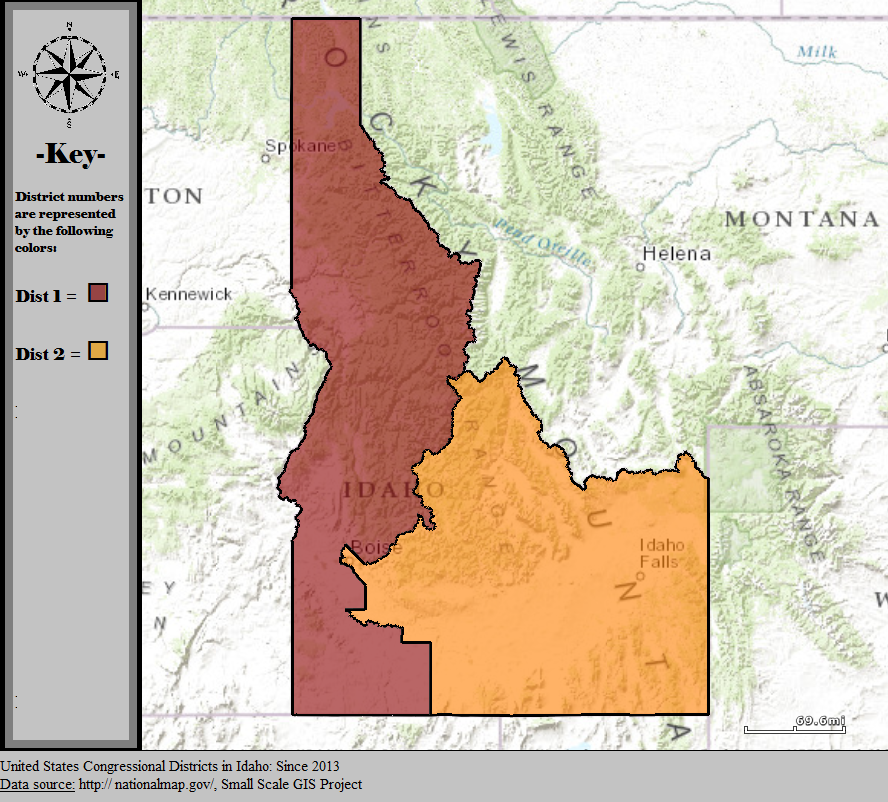
Initial configurations of Idaho’s congressional districts split the state along north/south lines. Starting in 1970, this split was changed to be east/west, and only one county – Ada County home to Boise, the state’s largest city and capitol – was split. Since then, most of Ada County geographically has been in the 1st district, with most of Boise itself being in the 2nd district. These lines have remained mostly unchanged since, with only slight alterations to ensure population equality.
Traditionally a populist state, Idaho only voted for the Republican candidate five times in its first fifteen presidential elections. Since 1948, however, Idaho has only voted for a single Democrat for President – Lyndon B. Johnson in 1964 – and has become staunchly conservative at all levels. Democrats have had more limited success at the congressional level, having elected six Democrats to the House. As recently as 1964, Democrats held both House seats. The last Democrat elected, Walt Minnick, served a single term from 2009 to 2011. Minnick had a generally conservative voting record. The Club for Growth awarded Minnick a perfect score, and he was the only Democrat to be endorsed by the Tea Party in 2010. Even with this moderate record, he still lost by 10 points. No Democrat has mounted a credible House campaign in the state since.
A bipartisan commission is responsible for both congressional and legislative redistricting in Idaho. This commission is often referred to as an independent commission, but it shares more in common with bipartisan commissions in states like New Jersey than with independent commissions in Arizona, California, or Michigan. Legislative leadership (the majority and minority leaders in each of the legislature’s two chambers) selects four of the commissioners, and two more are selected by the party chairs of the two largest political parties.
Idaho’s population has grown extensively in the last few decades. The state is likely to gain a third congressional district following the 2030 Census. This would upend the state’s traditional redistricting approach. Democrats are likely to push for a competitive third district centered around Boise, while Republicans will try and secure a 3-0 delegation by continuing to crack Ada County.
Demographic breakdown
| District | White | Hispanic | Black | Asian | Native | Pacific |
| 1 | 82.7% | 9.9% | 0.9% | 2.1% | 3.6% | 0.4% |
| 2 | 80.3% | 12.2% | 1.4% | 2.6% | 3.0% | 0.4% |
| State | 81.5% | 11% | 1.2% | 2.4% | 3.3% | 0.4% |
With a non-Hispanic white population of 81.5%, Idaho ranks among the least diverse states in the country. Both of Idaho’s congressional districts are roughly in line with statewide demographics, with the more urban 2nd-district being slightly more diverse.
Notably, Idaho’s Black population of 1.2% is the third-lowest of any state. Only its neighboring states of Montana and Wyoming have a smaller share. Its Hispanic population ranks 15th nationally, one of the few areas in which Idaho ranks as more diverse than the national average.
Idaho is home to five recognized tribes (the Shoshone-Bannock, the Shoshone-Paiute, the Coeur d’Alene, the Kootenai, and the Nez Perceseveral) and four major reservations. Each of Idaho’s congressional districts contains two of these reservations. Both districts have a similar share of adults that identify as Indian or Native American.
| District | Bachelor’s or higher | Rank (of 435) | Non-college white | Rank (of 435) |
| 1 | 27.0% | 284 | 62.9% | 58 |
| 2 | 30.5% | 221 | 58.1% | 89 |
Idaho’s educational attainment ranks as relatively average. Both of Idaho’s congressional districts rank in the third quartile (below-average) in percentage of adults with a bachelor’s degree. Additionally, both districts rank in the 1st quartile in non-college white voters. Of the two districts, the 2nd ranks as the more educated.
Political history
| District | Biden | Trump | Margin | Shift |
| 1 | 29.5% | 67.7% | R+38.2% | D+0.9% |
| 2 | 36.9% | 59.8% | R+22.9% | D+1.6% |
| State | 33.1% | 63.9% | R+30.8% | D+1.0% |
Idaho trended slightly to the left from 2016 to 2020, although this comes with a caveat. In 2016, Idaho recorded one of the highest shares of third-party votes in the country, with Evan McMullin pulling 6.7% of the vote and Libertarian Gary Johnson winning 4.1%. McMullin racked up double-digit percentages across the majority-Mormon counties in Idaho’s southeast. He even finished second in several counties, including Madison (29.8%), Franklin (16.6%), and Jefferson (13.6%).
This third-party vote share utterly cratered in 2020, with only just over 3% of voters opting for third-party candidates. Because of this, both parties saw their raw vote share increase. However, Trump’s margin of victory declined slightly from 31.8% to 30.8%. This shift of 1% was far less than the national swing towards Democrats. It was most apparent in the 2nd district, which contains the increasingly Democratic capitol of Boise, several liberal ski counties, and all of the state’s majority-Mormon counties.
2022 election results
| District | Incumbent | Democratic | Republican | Result |
|---|---|---|---|---|
| 1 | Russ Fulcher (R) | 26.3% | 71.3% | R+45% |
| 2 | Mike Simpson (R) | 36.4% | 63.6% | R+27.2% |
As expected, neither of Idaho’s congressional districts were competitive in the 2022 cycle. Both incumbent Republicans outperformed Trump’s 2020 margins by wide margins, although the 2nd district remained the more competitive of the two.
Current Representatives
- ID-01: Russ Fulcher (R-Meridian)
- ID-02: Mike Simpson (R-Idaho Falls)