


Redistricting history and process

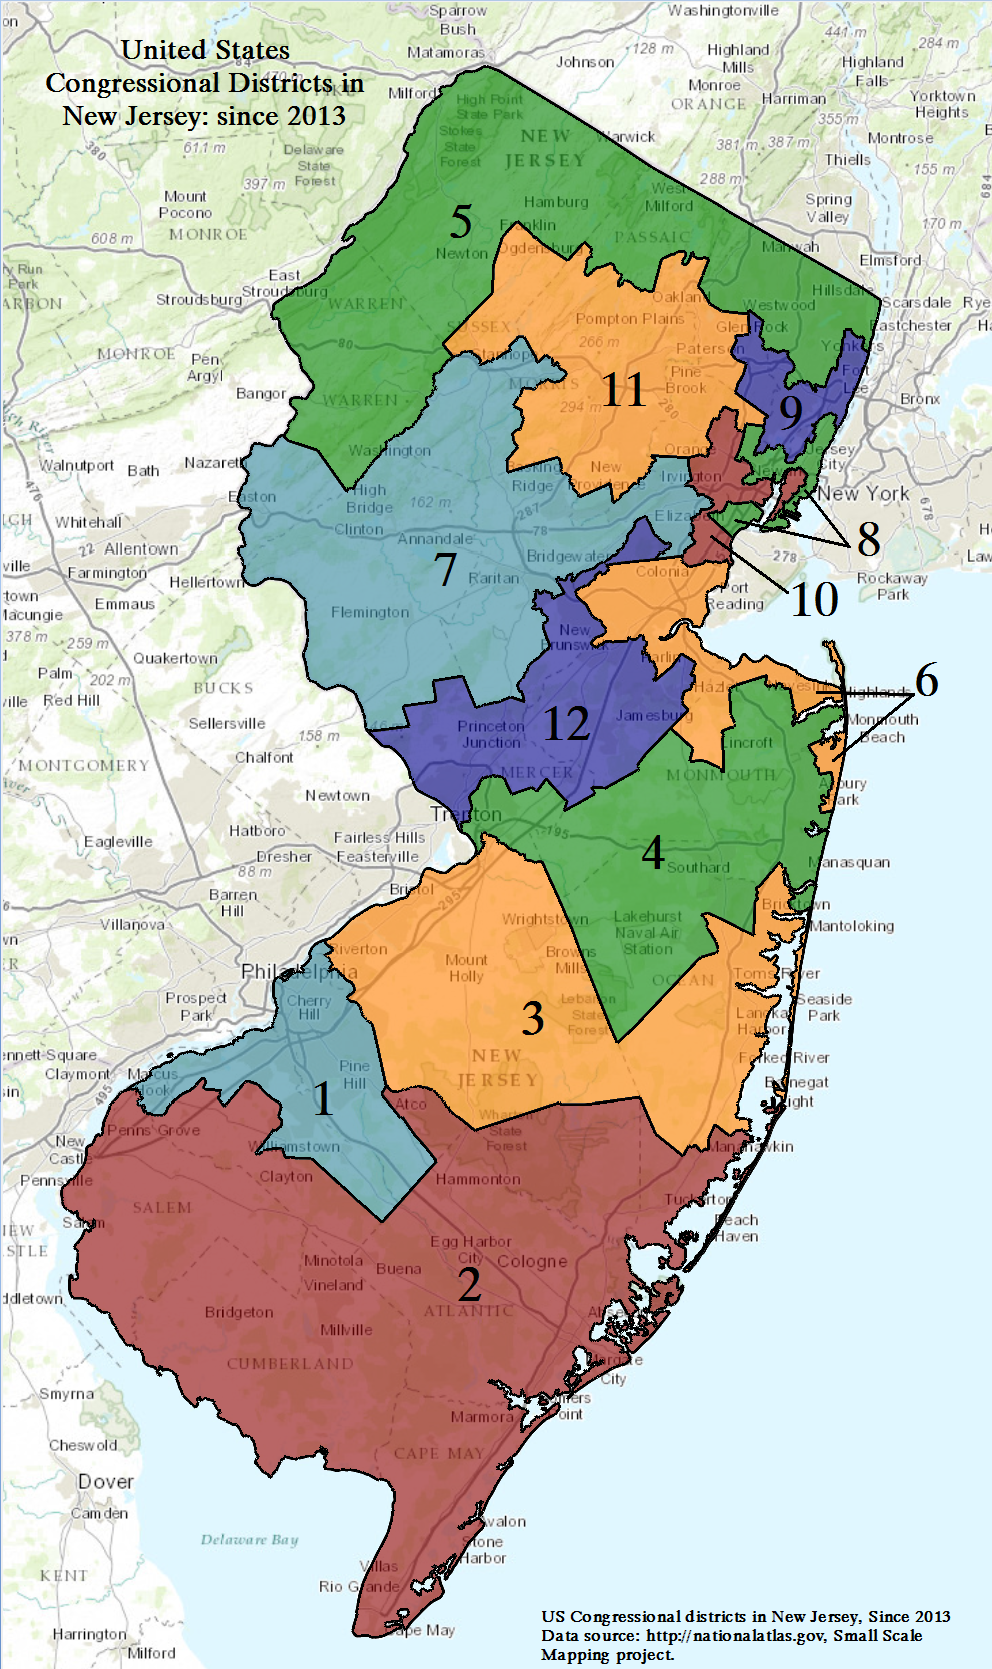
New Jersey has had as many as 15 congressional districts. In recent decades, the state has frequently lost districts; it lost its 15th district after the 1980 Census, its 14th following the 1990 Census, and its 13th following the 2010 Census. New Jersey was widely expected to lose a district following the 2020 Census, but it bucked expectations by holding on. Following the 2022 elections, Democrats hold a 9-3 advantage in the delegation.
In New Jersey, congressional and legislative districts are drawn by separate bipartisan commissions. These commissions are evenly-split on partisan lines, with the tie-breaking vote going to a lone independent appointed on a bipartisan basis; if the commission fails to agree on this member, the state Supreme Court decides again.
This system, while well-intentioned, is poorly devised. Rather than working on a bipartisan basis, Republicans and Democrats tend resenting separate maps for the independent member to vote on. This has led to New Jersey frequently having congressional and legislative districts that feature unusual lines and unrepresentative results.
This can be best seen in the previous decade’s lines; Republicans won out in the congressional battle, passing a Republican-favoring map along party lines that would lock in a 6-6 delegation from 2012 to 2016 in a state that routinely backs Democrats by double-digits. In contrast, the state legislative map was passed by Democrats along party lines and greatly favored Democrats; the party was able to avoid losing a single seat in 2013’s legislative elections despite losing the popular vote amidst Chris Christie’s 22-point landslide.
The most recent redistricting cycle was controverisal. John Wallace, a former state Supreme Court Justice, sided with Democrats, passing a map that favored the party. His stated reasoning was that the previous decade’s map had favored Republicans. Republicans filed lawsuits to strike down the map, but these lawsuits were dismissed by courts. The map faced further controversy due to the involvement of Princeton professor Sam Wang, who was accused of manipulating data to favor Democrats. The university later cleared Wang of these allegations; according to the New Jersey Globe, the university opted not to interview political leaders on either side, Wallace, or members of the Princeton Gerrymandering Project, an organization Wang led.
Demographic breakdown
| District | White | Hispanic | Black | Asian | Native | Pacific |
| 1 | 63.1% | 12.6% | 17.8% | 6.0% | 1.6% | 0.2% |
| 2 | 67.4% | 14.8% | 12.6% | 4.3% | 2.0% | 0.2% |
| 3 | 65.9% | 9.8% | 14.2% | 9.2% | 1.4% | 0.1% |
| 4 | 82.0% | 9.1% | 4.2% | 3.3% | 1.2% | 0.1% |
| 5 | 61.2% | 14.9% | 7.0% | 16.7% | 1.1% | 0.1% |
| 6 | 45.2% | 22.1% | 12.7% | 19.7% | 1.4% | 0.2% |
| 7 | 73.5% | 10.8% | 5.9% | 8.7% | 1.1% | 0.1% |
| 8 | 26.8% | 48.9% | 11.2% | 13.3% | 2.2% | 0.2% |
| 9 | 40.9% | 39.1% | 10.9% | 10.1% | 1.9% | 0.2% |
| 10 | 20.3% | 20.1% | 52.7% | 7.5% | 1.5% | 0.2% |
| 11 | 64.0% | 15.2% | 7.8% | 12.4% | 1.0% | 0.1% |
| 12 | 43.5% | 19.2% | 17.7% | 19.5% | 1.4% | 0.2% |
| State | 54.5% | 19.7% | 14.5% | 10.9% | 1.5% | 0.2% |
New Jersey ranks as one of the ten most diverse states in the country. While the state as a whole has a white majority and all but two of New Jersey’s congressional districts are majority or plurality-white, it has large minorities of black (19.7%), hispanic (14.5%), and Asian (10.9%) voters. The two majority or plurality-minority seats are the 8th district, a plurality-Hispanic seat, and the 10th district, a majority-black seat. Minority populations are concentrated in both the affluent suburbs of North Jersey and the state’s large cities like Newark, Jersey City, Paterson, and Elizabeth.
New Jersey is also home to one of the largest Jewish populations in the country. Around 5-6% of the population is Jewish. Like its neighbor state, New York, New Jersey’s Jewish population encompasses both secular and liberal Jews as well as Orthodox communities. Lakewood Township – the state’s fifth-largest city with a population of over 135,000 people – is predominantly Orthodox Jewish.
| District | Bachelor’s or higher | Rank (of 435) | Non-college white | Rank (of 435) |
| 1 | 32.1% | 189 | 44.1% | 212 |
| 2 | 28.0% | 269 | 49.6% | 159 |
| 3 | 42.8% | 78 | 39.7% | 258 |
| 4 | 37.2% | 125 | 53.5% | 125 |
| 5 | 52.3% | 24 | 32.3% | 299 |
| 6 | 40.2% | 96 | 32.9% | 296 |
| 7 | 52.1% | 25 | 37.5% | 272 |
| 8 | 37.0% | 131 | 15.7% | 394 |
| 9 | 31.8% | 193 | 30.0% | 313 |
| 10 | 30.2% | 227 | 12.5% | 411 |
| 11 | 56.2% | 18 | 29.4% | 319 |
| 12 | 47.6% | 47 | 26.9% | 337 |
As one of the nation’s most suburban and wealthiest states, New Jersey has a substantially higher than average population of college-educated voters. Half of the state’s districts rank in the top quartile for educational attainment, and only two (the South Jersey-based 2nd and North Jersey-based 10th) rank outside the second quartile.
Educational attainment splits somewhat across party lines; suburban voters remain persuadable to some degree in a handful of New Jersey’s congressional districts, specifically the competitive 7th district, while Democrats maintain a foothold in the 1st. However, Democrats have made substantial gains with suburban voters in recent years, upending longtime Republican incumbents.
Political history
| District | Biden | Trump | Margin | Shift |
| 1 | 61.6% | 37.1% | D+24.5% | D+1.1% |
| 2 | 46.8% | 51.8% | R+5% | D+2.1% |
| 3 | 56.4% | 42.3% | D+14.1% | D+4.6% |
| 4 | 38.1% | 60.6% | R+22.5% | D+5.5% |
| 5 | 55.6% | 43.2% | D+12.4% | D+4.7% |
| 6 | 59.2% | 39.5% | D+19.7% | D+0.7% |
| 7 | 51.0% | 47.4% | D+3.7% | D+9.3% |
| 8 | 71.9% | 27.1% | D+44.8% | R+9.5% |
| 9 | 59.0% | 40.0% | D+19.0% | R+5% |
| 10 | 80.9% | 18.3% | D+62.5% | R+2.9% |
| 11 | 57.8% | 41.0% | D+16.8% | D+6.1% |
| 12 | 66.5% | 32.2% | D+34.3% | D+2.9% |
| State | 57.3% | 41.4% | D+15.9% | D+1.8% |


New Jersey’s congressional districts have a strong Democratic bent. Joe Biden carried 10 of the districts, while Donald Trump carried only two; only two districts, the 2nd and 7th, were within 10 percentage points. This Democratic bent differs drastically from the previous decade, which saw seats broadly skewed towards Republicans.
With most of the state’s districts trending marginally or moderately Democratic from 2016 to 2020, Democrats can be fairly confident in their odds of retaining a decisive majority of New Jersey congressional districts for years to come.
2022 election results
| District | Incumbent | Democratic | Republican | Result |
|---|---|---|---|---|
| 1 | Donald Norcross (D) | 62.3% | 35.2% | D+27.1% |
| 2 | Jeff Van Drew (R) | 40.0% | 58.9% | R+18.9% |
| 3 | Andy Kim (D) | 55.5% | 43.6% | D+11.9% |
| 4 | Chris Smith (R) | 31.4% | 66.9% | R+35.5% |
| 5 | Josh Gottheimer (D) | 54.7% | 44.3% | D+10.4% |
| 6 | Frank Pallone (D) | 57.5% | 41.0% | D+16.5% |
| 7 | Tom Malinowski (D) | 48.6% | 51.4% | R+2.8% (FLIP) |
| 8 | OPEN | 73.6% | 23.4% | D+50.2% |
| 9 | Bill Pascrell (D) | 54.5% | 43.6% | D+10.9% |
| 10 | Donald Payne Jr. (D) | 77.6% | 20.0% | D+57.6% |
| 11 | Mikie Sherrill (D) | 59.0% | 40.2% | D+18.8% |
| 12 | Bonnie Watson Coleman (D) | 63.1% | 35.9% | D+27.2% |
As expected, only one district – the 7th – was truly competitive this cycle. Curiously, however, a handful of incumbents drastically underperformed or overperformed relative to partisan baselines. Strong Democratic incumbents like Mikie Sherrill and Andy Kim – first elected in 2018’s blue wave – were able to easily withstand a more Republican environment. However, Bill Pascrell in the Biden+19 9th district – a plurality-Hispanic seat – only won by 10.9% amidst a decline in Hispanic turnout.
On the Republican side, incumbents Jeff Van Drew and Chris Smith both overperformed in their Republican-leaning districts. Van Drew’s performance is particularly impressive; he won his Trump+5 seat by almost 19 percentage points. In the 7th district, the state’s lone truly competitive seat, Republican Tom Kean Jr. narrowly unseated incumbent Democrat Tom Malinowski in a rematch.
Going forward, the 7th district is likely to remain the state’s only competitive seat for the foreseeable future, barring a reversal of trends in South Jersey or a realignment among minority voters.
Current Representatives
- NJ-01: Donald Norcross (D-Camden)
- NJ-02: Jeff Van Drew (R-Dennis Township)
- NJ-03: Andy Kim (D-Moorestown)
- NJ-04: Chris Smith (R-Manchester Township)
- NJ-05: Josh Gottheimer (D-Wyckoff)
- NJ-06: Frank Pallone (D-Long Branch)
- NJ-07: Tom Kean Jr. (R-Westfield)
- NJ-08: Rob Menendez (D-Jersey City)
- NJ-09: Bill Pascrell (D-Patterson)
- NJ-10: Donald Payne Jr. (D-Newark)
- NJ-11: Mikie Sherrill (D-Montclair)
- NJ-12: Bonnie Watson Coleman (D-Ewing Township)