


Redistricting history and process

Kentucky has had six congressional districts since the 1990 census, when it lost its 7th district. In Kentucky, both congressional and state legislative maps are drawn by the legislature. The Governor has the ability to veto maps – however, unusually, vetoes in Kentucky can be overridden by majority vote.
Guidelines created by the legislature suggest that congressional districts should be contiguous, respecting both county lines and communities of interest. State legislative districts are legally required by the constitution to be contiguous and to respect county lines when possible.
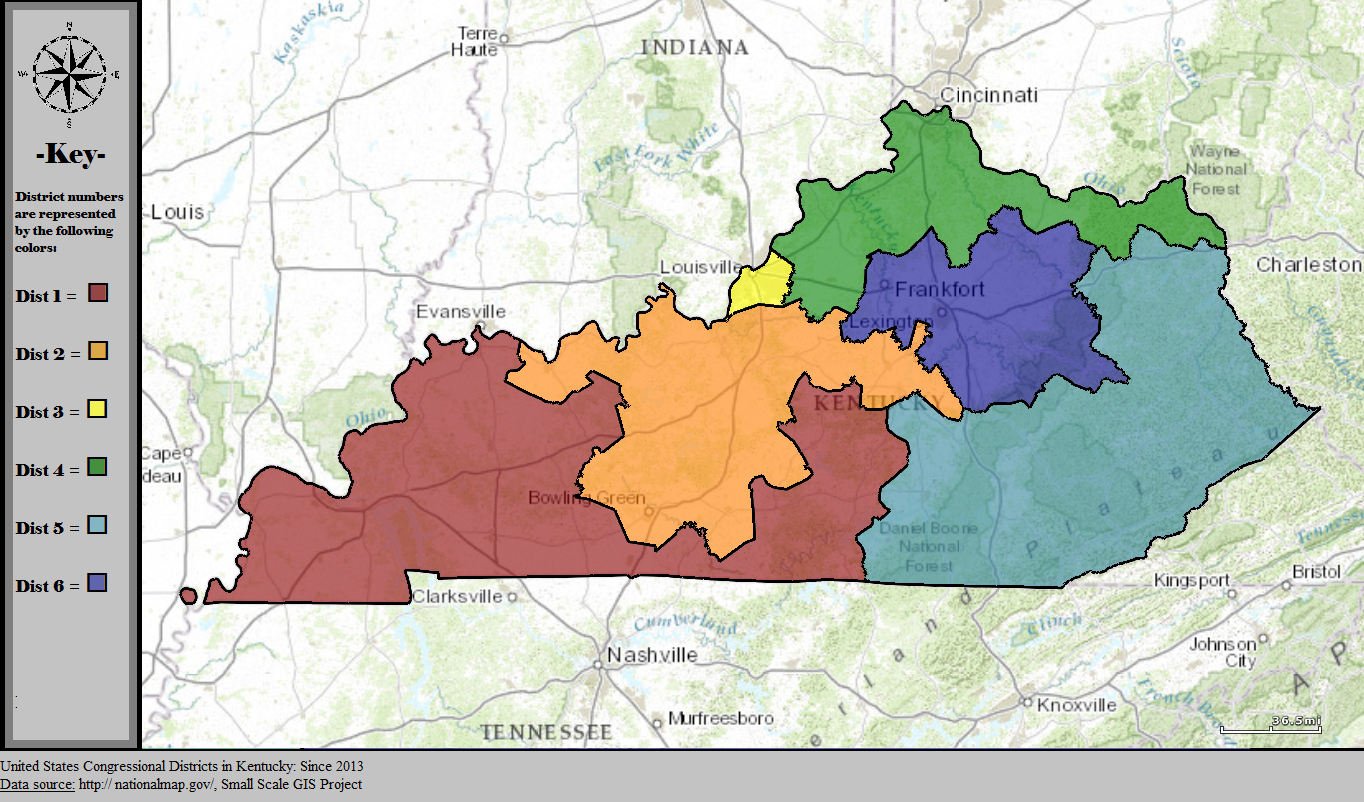
Kentucky Governor Andy Beshear, a Democrat, vetoed the legislature’s proposed congressional map. However, the legislature overrode his veto, and the map was enacted into law. The map preserves a 5-1 Republican advantage in the state. Although no districts are competitive, the map can only really be described as a mild gerrymander given the state’s decisively Republican lean.
Demographic breakdown
| District | White | Hispanic | Black | Asian | Native | Pacific |
| 1 | 85.8% | 3.0% | 7.9% | 1.0% | 2.0% | 0.1% |
| 2 | 85.7% | 3.4% | 6.3% | 2.3% | 2.1% | 0.2% |
| 3 | 65.6% | 6.9% | 22.0% | 3.8% | 1.9% | 0.2% |
| 4 | 88.6% | 3.4% | 4.0% | 1.5% | 2.1% | 0.2% |
| 5 | 94.1% | 1.3% | 2.0% | 0.5% | 1.8% | 0.1% |
| 6 | 81.0% | 5.0% | 9.1% | 2.8% | 2.0% | 0.2% |
| State | 83.4% | 3.8% | 8.6% | 2.0% | 2.0% | 0.2% |
Kentucky is one of the whitest states in the country, and all of its congressional districts are majority white. The most diverse of the state’s districts is the Louisville-based 3rd district. With a black population of 22%, it’s the only district in the state where a single minority group comprises even 10% of the population. Conversely, the highly rural 5th district is the single whitest congressional district in the United States.
| District | Bachelor’s or higher | Rank (of 435) | Non-college white | Rank (of 435) |
| 1 | 19.6% | 410 | 71.3% | 15 |
| 2 | 22.0% | 376 | 70.5% | 20 |
| 3 | 32.8% | 181 | 45.9% | 192 |
| 4 | 28.5% | 262 | 66.2% | 45 |
| 5 | 14.2% | 432 | 82.7% | 1 |
| 6 | 33.6% | 171 | 56.9% | 97 |
Kentucky’s educational attainment is well below average. Only two of the state’s six districts even rank in the second quartile for college attainment, and only one (KY-06) ranks above the national average. Moreover, all but one (KY-03) of Kentucky’s congressional districts are in the top 100 for non-college whites, and even with its more diverse population, the Louisville-based 3rd district is still only in the second quartile.
At 82.7%, KY-05 – based almost entirely in the eastern Kentucky coalfields – is by far the district with the highest percentage of non-college educated whites.
Political history
| District | Biden | Trump | Margin | Shift |
| 1 | 27.9% | 70.6% | R+42.7% | D+1.6% |
| 2 | 30.9% | 67.4% | R+36.5% | D+3.3% |
| 3 | 60.2% | 37.9% | D+22.3% | D+6.9% |
| 4 | 32.7% | 65.5% | R+32.8% | D+4% |
| 5 | 19.7% | 79.0% | R+59.3% | D+0.7% |
| 6 | 43.5% | 54.5% | R+11 | D+6.6% |
| State | 36.2% | 62.1% | R+25.9% | D+3.9% |
Despite pressure from some national Republicans, Kentucky’s Republican-dominated legislature opted not to produce a harsh 6-0 Republican gerrymander; this would have been made possible by cracking the city of Louisville, presently existing in the Democratic-dominated 3rd district, into multiple seats. Instead, Republicans opted to produce a status quo map.
As a highly white and conservative state, almost every district in Kentucky is dominated by Republicans and thoroughly uncompetitive. Four of the state’s six districts (KY-01 and KY-05) gave Trump more than 65% of the vote, all of them ranking in the top 50 most Republican districts in the nation (KY-05 ranks 2nd, KY-01 ranks 15th, KY-02 ranks 36th, and KY-04 ranks 45th). Kentucky’s remaining two congressional districts are based around the state’s two largest cities – Louisville in the 3rd, and Lexington in the 6th.
Curiously, Republicans only marginally shored up the 6th district, which went from Trump+9 to Trump+11. While this isn’t necessarily the fairest way to draw the seat – a more compact version might be in the neighborhood of Trump+7 – it’s such a mild gerrymander as to be barely functional at all. Like in 2018, when the old district was decided by less than five percentage points, the new district could well be competitive in the years to come; it backed Democrat Jim Gray for Senate in 2016, supported Democrat Andy Beshear by double-digits in 2019, and was within single-digits in the 2020 Senate race.
2022 election results
| District | Incumbent | Democratic | Republican | Result |
|---|---|---|---|---|
| 1 | James Comer (R) | 25.1% | 74.9% | R+49.8% |
| 2 | Brett Guthrie (R) | 28.1% | 71.9% | R+43.8% |
| 3 | OPEN | 62% | 38% | D+24% |
| 4 | Thomas Massie (R) | 31% | 65% | R+34% |
| 5 | Hal Rogers (R) | 17.8% | 82.2% | R+64.4% |
| 6 | Andy Barr (R) | 33.6% | 62.7% | R+29.1% |
As expected ahead of the election, none of Kentucky’s congressional races were competitive, with each winner outperforming the partisan baseline of their district. Only one district was considered even remotely competitive: the 6th district, a Trump+11 seat that has seen competitive races in the past. However, this cycle, it instead saw one of the strongest Republican over-performances in the country.
Andy Barr – who nearly lost in 2018 to Democrat Amy McGrath – won an astonishing 29-point landslide. What caused this massive over-performance? An exceptionally poor Democratic candidate: Geoff Young, a perennial candidate who is a staunch supporter of bothChina and Russia. State Democrats effectively disowned Young, allowing Barr to narrowly win Fayette County, which voted for Biden by 21 percentage points in 2020.
Current Representatives
- KY-01: James Comer (R-Tompkinsville)
- KY-02: Brett Guthrie (R-Bowling Green)
- KY-03: Morgan McGarvey (D-Louisville)
- KY-04: Thomas Massie (R-Garrison)
- KY-05: Hal Rogers (R-Somerset)
- KY-06: Andy Barr (R-Lexington)