


Redistricting history and process

Since it attained statehood in 1819, Alabama has had as many as 10 congressional districts. However, due to state and nationwide population shifts, the state has had seven congressional districts since 1972. Alabama was widely expected to lose a congressional district as a result of the 2020 Census, but surprisingly managed to stave this off – for now. The state remains at risk of losing a district following the next census in 2030 due to slow population growth.
Alabama has generally retained similar congressional configurations over the last five decades, but several key changes have been made as the state has transitioned from a reliably Democratic one to a Republican stronghold. From 1973 to 1992, the state adopted a congressional configuration that split Birmingham and Montgomery into separate seats; since 1992, it has tended to combine the urban cores of both counties into a single seat, joined together by nearly a dozen smaller, rural counties.
In Alabama, the legislature has responsibility for redrawing congressional districts, and the Governor has the ability to veto maps they disapprove of. The current congressional map was approved along mostly party-line votes in the House and Senate and was signed into law by Republican Governor Kay Ivey. Democrats uniformly opposed the map, arguing it was a partisan and racial gerrymander. On June 8, 2023, the congressional map was struck down by the Supreme Court in Allen v. Milligan in a 5-4 ruling. As a result, Alabama will be forced to redraw the map for the 2024 cycle to include a second VRA district.
Demographic breakdown
| District | White | Hispanic | Black | Asian | Native | Pacific |
|---|---|---|---|---|---|---|
| 1 | 66.0% | 3.2% | 25.6% | 1.8% | 3.1% | 0.1% |
| 2 | 62.0% | 3.6% | 30.1% | 2.3% | 2.1% | 0.2% |
| 3 | 67.7% | 3.1% | 25.0% | 2.1% | 2.1% | 0.1% |
| 4 | 82.4% | 5.7% | 7.7% | 0.8% | 3.5% | 0.1% |
| 5 | 70.9% | 5.3% | 18.1% | 2.5% | 3.3% | 0.2% |
| 6 | 71.2% | 5.4% | 18.9% | 2.3% | 2.2% | 0.1% |
| 7 | 38.6% | 3.7% | 55.3% | 1.5% | 1.3% | 0.1% |
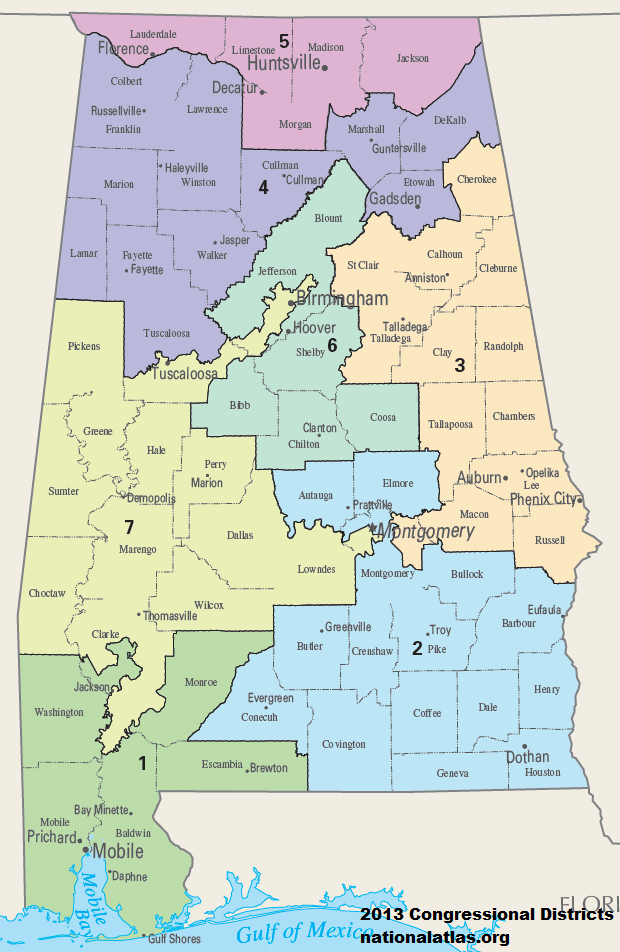
The landscape of Alabama’s congressional districts is perhaps most defined by the sharp divide between the 7th district and the rest of the state. Following the 1992 cycle, the 7th district was redrawn into a majority-black seat; Earl Hilliard, a Democrat, was elected as the first Black person to represent the state in Congress in over 100 years. The presence of this district, mandated by the Voting Rights Act (VRA), ensures that the state has some Black representation in Congress; without VRA protections, it would be fairly easy to create a map with no Democratic districts.
However, it also functions as somewhat of a double-edged sword, as the remaining seats are overwhelmingly white. A second majority-black seat could theoretically be drawn, but attempts to mandate such a seat through federal lawsuits have been unsuccessful. The Supreme Court, and federal courts in general, are not expected to change this status quo any time soon.
With a voting-age Black population of 55.3%, the 7th district is the only majority-Black seat in the state. The remaining six seats are all majority-White, with voting-age populations ranging from 62% to 82%; districts 2 and 3 are broadly rural and include some areas or counties with large Black populations, while the Mobile-based district 1 also contains a large Black population. District 4 – a very rural seat situated between Birmingham and Huntsville – is not just the whitest district in the state, but is one of the whitest in the country.
| District | Total | College | College% | Rank (of 435) |
|---|---|---|---|---|
| 1 | 486,900 | 124,683 | 25.6% | 311th |
| 2 | 481,226 | 121,581 | 25.3% | 318th |
| 3 | 470,223 | 98,996 | 21.1% | 391th |
| 4 | 485,968 | 85,992 | 17.7% | 426th |
| 5 | 475,621 | 160,883 | 33.8% | 169th |
| 6 | 479,277 | 179,116 | 37.4% | 122th |
| 7 | 464,791 | 105,793 | 22.8% | 364th |
Educational attainment in most of Alabama’s congressional districts is quite low. The districts with the most college-educated adults are the suburban 6th (37.4%) and Huntsville-based 5th (33.8%). The remaining four districts rank well in the bottom half in the nation, with the 4th being the 10th-least college educated district in the nation.
Political history
| District | Biden% | Trump% | 2020 Margin | Shift (2016-20) |
|---|---|---|---|---|
| 1 | 35.2% | 63.5% | R+28.2% | D+0.9% |
| 2 | 34.7% | 64.1% | R+29.4% | D+3.2% |
| 3 | 32.4% | 66.4% | R+34.0% | D+0.5% |
| 4 | 18.6% | 80.2% | R+61.7% | R+0.7% |
| 5 | 35.5% | 62.5% | R+27.0% | D+6% |
| 6 | 34.2% | 64.1% | R+29.9% | D+8.4% |
| 7 | 65.5% | 33.4% | D+32.1% | D+1.4% |
| State | 36.6% | 62.0% | R+25.4% | D+2.3% |
From 1900 to 1964, Alabama returned an exclusively Democratic delegation to Congress. This streak was broken in the 1964 election, when Republicans won five of the state’s eight districts. While Democrats were able to quickly regain a majority the following cycle, the state’s red shift could only be held off for so long; Republicans won a majority in the “Republican Revolution” of 1994, and haven’t lost it since.
Because the 7th district is so overwhelmingly Democratic (it gave Joe Biden a 32-point win in 2020), the remaining sats are extremely conservative. And most importantly, all of them are to the right of the state as a whole. The least Republican of the bunch, the 5th district, voted for Donald Trump by a 27.1% margin in 2020; every single one would have voted for Roy Moore in the 2017 special election despite his narrow statewide defeat. Democrats did, however, make substantial gains in the Huntsville-based 5th district and the suburban 6th district, although it would take decades for either district to become somewhat competitive. The 4th district, meanwhile, is the most Republican district in the nation – it’s the only congressional district where Donald Trump received over 80% of the vote.
Despite Republican dominance in the congressional delegation, Democrats held three districts as recently as 2009. The 5th remained in Democratic hands from 1869 to 2009, when Rep. Parker Griffith switched parties, and the 2nd was held by conservative Democrat Bobby Bright for a single term from 2009-11. Ironically, Griffith – who lost his primary and hasn’t held office since – has since switched back to the Democratic Party, while Bright has become a Republican and even attempted a comeback to his old district as one.
2022 Election Results
| District | Incumbent | Democratic | Republican | Margin | 2020-22 Shift |
|---|---|---|---|---|---|
| AL-01 | Jerry Carl (R) | N/A | 83.6% | R+67.9% | R+39.6% |
| AL-02 | Barry Moore (R) | 29.1% | 69.1% | R+40.0% | R+10.6% |
| AL-03 | Mike Rogers (R) | 25.1% | 71.2% | R+46.1% | R+12.0% |
| AL-04 | Robert Aderholt (R) | 13.6% | 84.1% | R+70.5% | R+8.7% |
| AL-05 | Mo Brooks (R, retiring) | 29.5% | 67.1% | R+37.6% | R+10.5% |
| AL-06 | Gary Palmer (R) | N/A | 87.7% | R+72.6% | R+42.6% |
| AL-07 | Terri Sewell (D) | 63.5% | 34.8% | D+28.8% | R+3.2% |
In the 2022 midterms, Republicans easily held their 6-1 advantage in Alabama’s congressional districts. Relative to the 2020 presidential election, all of the congressional districts in Alabama shifted to the right. All but two of them shifted by double-digit margins.
No districts were even remotely competitive, with the closest being decided by nearly 29 percentage points. Democrats did not even bother to field candidates in two districts – the 1st and 6th districts – leaving only minor-party candidates as opposition.
Current Representatives
- AL-01: Jerry Carl (R-Mobile)
- AL-02: Barry Moore (R-Enterprise)
- AL-03: Mike Rogers (R-Weaver)
- AL-04: Robert Aderholt (R-Haleyville)
- AL-05: Dale Strong (R-Huntsville)
- AL-06: Gary Palmer (R-Hoover)
- AL-07: Terri Sewell (D-Birmingham)